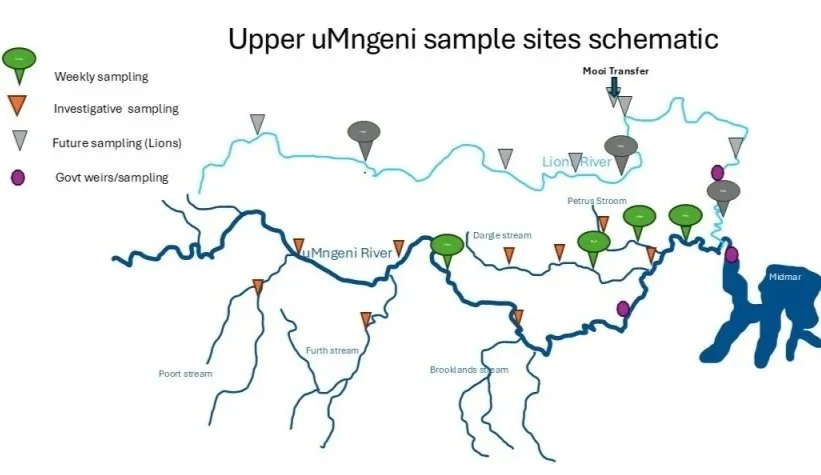
Having completed three years of river monitoring on the upper uMngeni above Midmar, and with the last 12 months having been consistently sampled every week , we are ready to show you the powerful message of the metrics. Click below to open the results resource.
(Note this will prompt a download …look at your downloads icon, normally top right of your screen…. click on it there and it should open in your browser. Best viewed on a computer. Apple phones struggle)
For a more detailed analysis of the all important NUTRIENT LOAD being contributed to Midmar dam, from our furthest downstream sampling point, click on the button below.
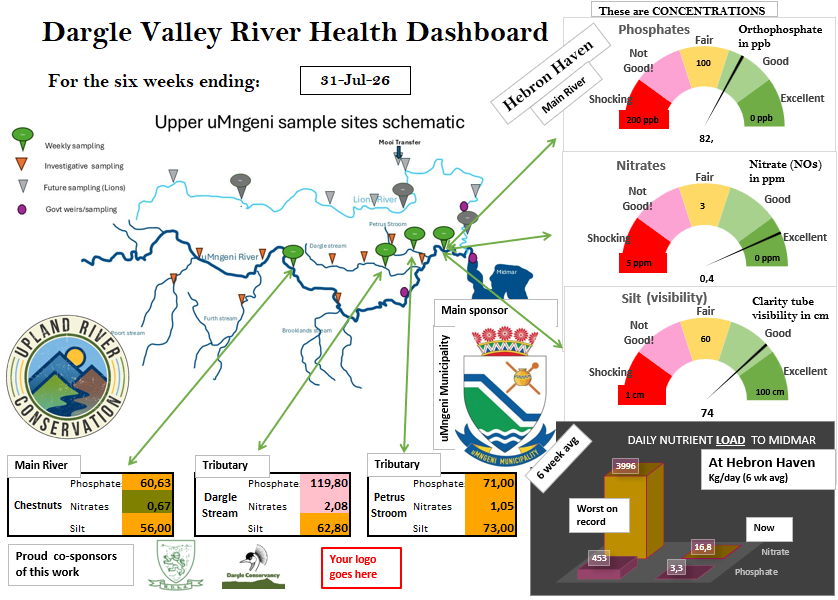
An example of our regular river health dashboard that goes out to valley residents
Sponsors of this work